The sports card market cleared a massive milestone in October 2026, with Card Ladder tracking $1.075 billion in card and sealed wax sales across 9,216,743 transactions. That headline is impressive on its own, but the deeper story is how unevenly that money was distributed.
A billion-dollar month does not mean every corner of the hobby is surging at the same pace. The October data points to a market powered by a relatively small number of expensive sales, supported by a strong collecting middle tier, while the vast majority of transactions took place at lower prices and accounted for a modest share of total dollars.
For collectors, dealers, and investors, that distinction matters. The size of the monthly total tells only part of the story. The price bands where that money changed hands tell a lot more about the market’s real shape.
October’s billion-dollar month was not evenly built
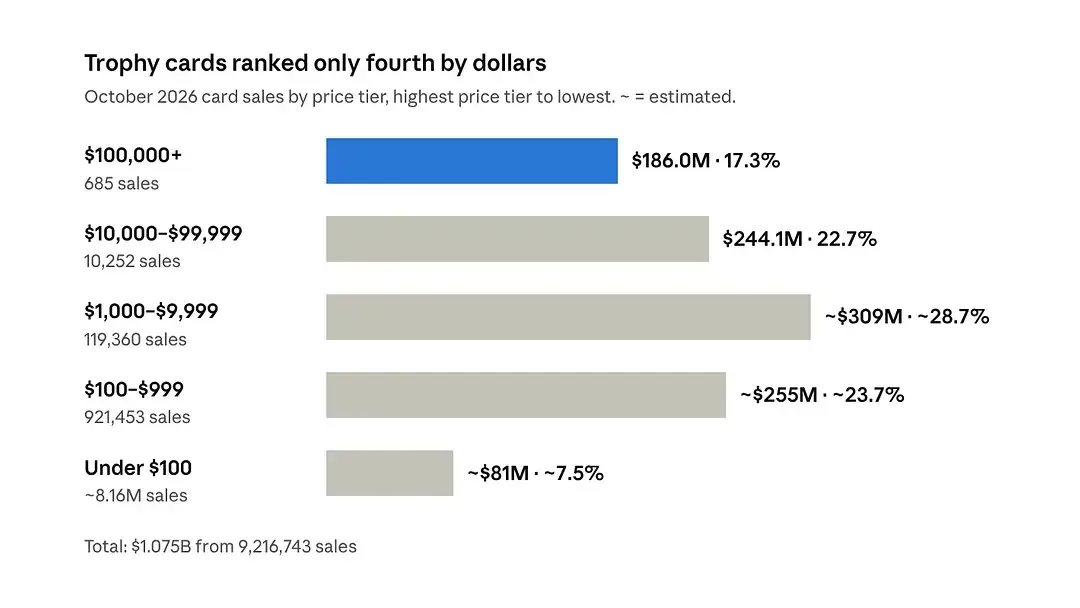
October’s $1.075 billion came from more than 9.2 million recorded sales, but the largest contribution by dollar volume did not come from the ultra-elite trophy card segment. Instead, the $1,000 to $9,999 tier produced the biggest share of money for the month.
For more collector background, read Trading Card Sales Topped $1 Billion in October 2026 as Record Activity Pushed the Hobby Higher.
That is an important point because the hobby conversation often gets dominated by seven-figure results, one-of-ones, Logoman patch autos, and major auction headlines. Those cards absolutely move attention, but they were not the biggest source of dollars in October.
The market, at least for this month, looked more like a pyramid than a straight line. At the base sat millions of low-cost sales. In the middle was a broad layer of meaningful spending from serious collectors. Near the top was a very small number of expensive purchases that still carried an outsized share of total value.
The $100,000-plus tier was huge in value, tiny in volume
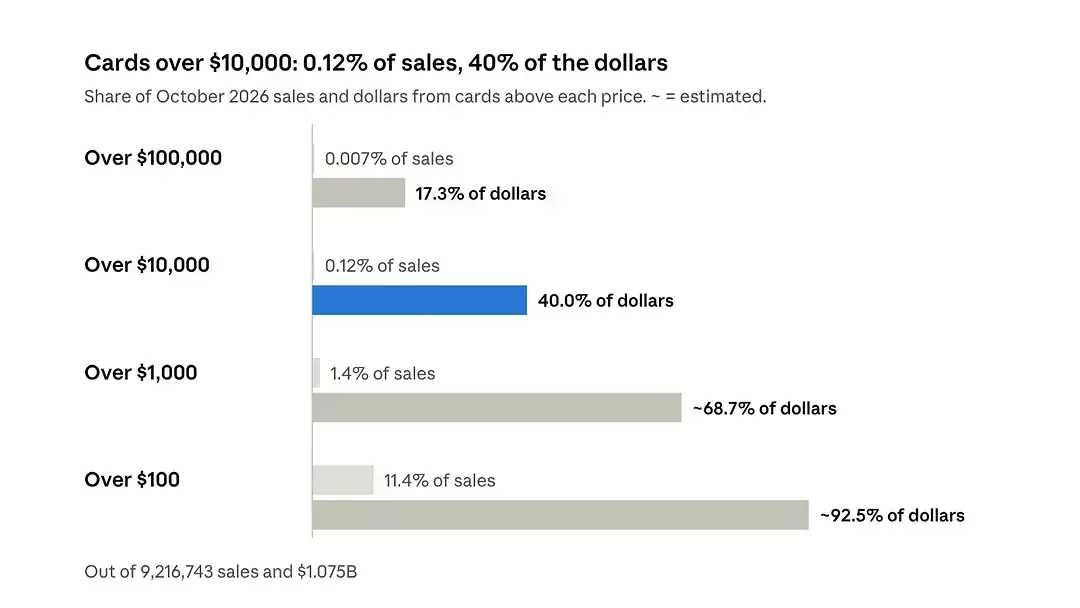
Cards selling for $100,000 or more generated $186.0 million in October. That amounted to 17.3% of the entire month’s total, coming from just 685 sales.
Put another way, fewer than two dozen such transactions happened per day on average across the entire hobby. Those 685 sales represented roughly one transaction for every 13,455 sales recorded during the month. The average price in that tier was about $271,582.
That level of spending shows the top of the market remains active and capable of swinging monthly totals in a major way. October included several headline-grabbing results, including:
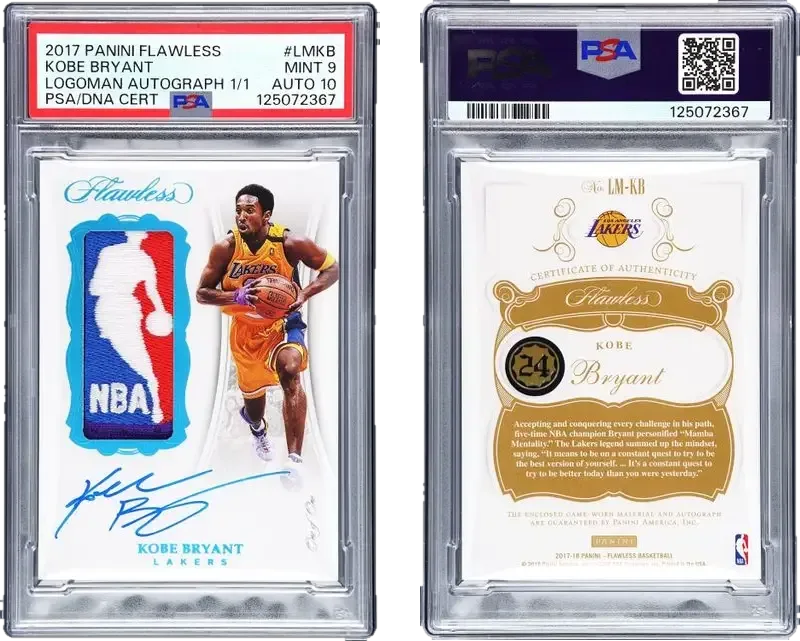
- 2017 Panini Flawless Logoman Autograph 1/1 #LMKB Kobe Bryant PSA 9/Auto 10 for $4.2 million
- 2026 Panini World Cup Prizm Choice Nebula 1/1 Lionel Messi BGS 9 for $1.25 million
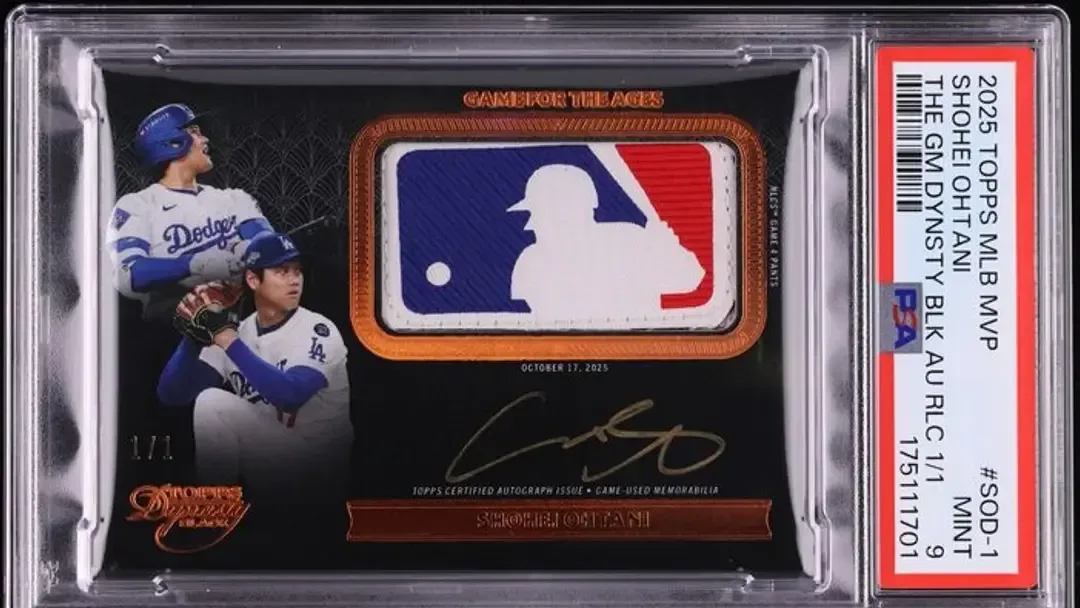
- 2025 Topps MLB MVP The Game Dynasty Black Shohei Ohtani MLB Logoman Patch Auto 1/1 #SOD-1 PSA 9 for $3.24 million
Those sales help explain why the month felt so large from a headline perspective. Still, the numbers also show that the top end alone did not create the billion-dollar month. The $100,000-plus category ranked behind a broader price band when measured by total dollars.
The biggest money came from the hobby’s upper-middle tier
The strongest dollar-producing segment in October was the $1,000 to $9,999 range, which accounted for about $309 million. This was the single largest pile of money in the entire market for the month.
That range often captures many of the cards collectors actively chase once they move beyond casual buying. It can include graded rookie cards, scarce parallels, low-numbered modern hits, important autographs, and established vintage pieces. It is expensive, but still broad enough to include a large number of committed participants rather than only a tiny population of elite buyers.
Just below that, the $100 to $999 tier added roughly $255 million. Combined, the two middle bands between $100 and $9,999 produced about $564 million, or approximately 52% of all dollars spent in October.
That is the clearest sign of structural strength in the monthly data. More than half of the money came from a part of the hobby that is neither bargain-bin flipping nor ultra-luxury trophy hunting. It came from the space where many active collectors, serious set builders, player collectors, and mid-to-high-end buyers actually live.
Sales above $10,000 carried 40% of the dollars
When the data expands beyond the six-figure tier and includes every sale above $10,000, the concentration becomes even more noticeable.
Roughly 11,000 transactions priced above $10,000 brought in around $430 million in October. That means about 40.0% of the month’s dollars came from approximately 0.12% of the month’s sales.
That is an extraordinarily top-heavy distribution. Nearly 100% of the transaction count came from lower-priced sales, yet a tiny slice of the market generated almost half the money.
For anyone using a monthly total as a shorthand for hobby health, this is where caution is needed. A strong month at the high end can make the full market look stronger than it may feel to collectors operating in other bands. The reverse is also true. If the top end softens, a huge monthly total can fall sharply even if everyday collecting activity remains stable.
The sub-$100 market was massive in activity, but small in dollars
The lower end of the hobby remained the busiest part of the market by far. About 8.16 million sales, or roughly 88.6% of all October transactions, closed for under $100.
Together, those sales contributed about $81 million, or just 7.5% of the month’s total dollars.
This segment includes much of the daily motion collectors actually experience: base cards, low-cost singles, inserts, raw cards, player lots, lower-end parallels, and PC additions. It is where many collectors enter the hobby and where much of the constant buying, selling, trading, and ripping is reflected in marketplace activity.
The takeaway is not that the low end is weak. It is that volume and value are very different things. The under-$100 market dominated transaction count, but its individual sale prices were too small to move the billion-dollar headline very much.
That difference is easy to miss when a single monthly figure is treated as a universal indicator.
What the numbers say about hobby strength
October’s sales distribution supports two ideas at the same time.
First, there are reasons to view the market positively. The middle tiers were strong. More than a million sales between $100 and $9,999 generated roughly half of all dollars for the month. That suggests active participation from a meaningful collector base willing to spend real money on cards that matter to them.
Second, the market remains highly sensitive to the top end. If 40% of dollars come from around 11,000 sales above $10,000, then monthly totals can shift dramatically even if ordinary collector behavior barely changes.
That makes broad market headlines less useful than they first appear. A month can look explosive because a handful of marquee auctions landed at once. A later month can look soft simply because fewer elite cards changed hands, even while the rest of the hobby remains steady.
Why a pullback at the top could change the headline fast
One of the clearest lessons from the October breakdown is how vulnerable monthly totals are to changes in the highest spending tiers.
If purchases above $10,000 were to decline by 25%, that would erase roughly $108 million from the month’s total based on October’s distribution. A move like that would cut about 10% from the overall monthly number, even if the other 99.88% of transactions stayed exactly the same.
That kind of swing would create a very different headline. It might even trigger broad talk about a cooling market. Yet many collectors buying in the $20, $200, or $2,000 range might not feel any change at all in their own segment.
The opposite can happen too. One strong run of major auction results can lift the total enough to create the impression of a market-wide boom, even if prices and demand are mostly flat in the categories where most collectors spend their time.
What collectors should watch instead of just the headline number
The most useful market signal is not the total dollars alone. It is the tier where those dollars were spent.
Collectors focused on affordable singles should pay attention to activity and pricing in the under-$100 segment. Buyers working in the stronger mid-range should watch the $100 to $9,999 bands, where October showed the deepest and healthiest spending base. High-end investors and consignors should closely follow the $10,000-plus segment, where fewer transactions can dramatically influence monthly totals.
For many participants, the middle tiers are likely the clearest temperature check. October showed that the $100 to $999 and $1,000 to $9,999 ranges were the hobby’s primary engine, not because they produced the loudest headlines, but because they represented sustained and substantial spending.
That matters more than a few blockbuster sales when evaluating how broad the market really is.
Key October 2026 card market figures
- Total sales tracked: 9,216,743
- Total market value: $1.075 billion
- $100,000-plus sales: 685 transactions
- $100,000-plus dollar volume: $186.0 million
- Share of total from $100,000-plus tier: 17.3%
- Estimated dollar volume from $10,000-plus sales: about $430 million
- Share of total from $10,000-plus sales: 40.0%
- Estimated dollar volume from $1,000 to $9,999 tier: about $309 million
- Estimated dollar volume from $100 to $999 tier: about $255 million
- Combined dollar volume from $100 to $9,999 tiers: about $564 million
- Combined share of total from $100 to $9,999 tiers: about 52%
- Estimated under-$100 sales count: about 8.16 million
- Share of all transactions under $100: about 88.6%
- Estimated under-$100 dollar volume: about $81 million
- Share of total dollars from under-$100 sales: 7.5%
What October’s numbers mean for the months ahead
If another billion-dollar month arrives soon, the first question should not be whether the hobby is booming. The better question is which price tier produced the gain.
If the increase comes from the middle, it would point to broad, stable participation from a large base of committed buyers. If it comes mostly from the top end, it would reinforce how much monthly totals can be shaped by a comparatively small set of expensive transactions.
October 2026 showed that the sports card market is large, active, and capable of extraordinary headline numbers. It also showed that those numbers make the most sense when broken into layers, especially in the $100 to $9,999 range where the market’s deepest spending base did the heaviest lifting.
Photo Gallery